MCAT Math Question 42: Answer and Explanation
Home > MCAT Test > MCAT math practice tests
Test Information
- Use your browser's back button to return to your test results.
- Do more MCAT math practice tests.
Question: 42
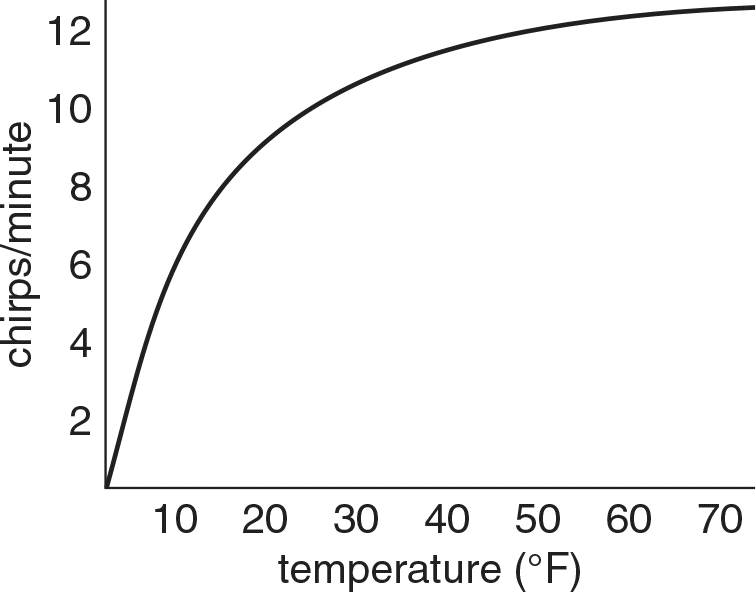
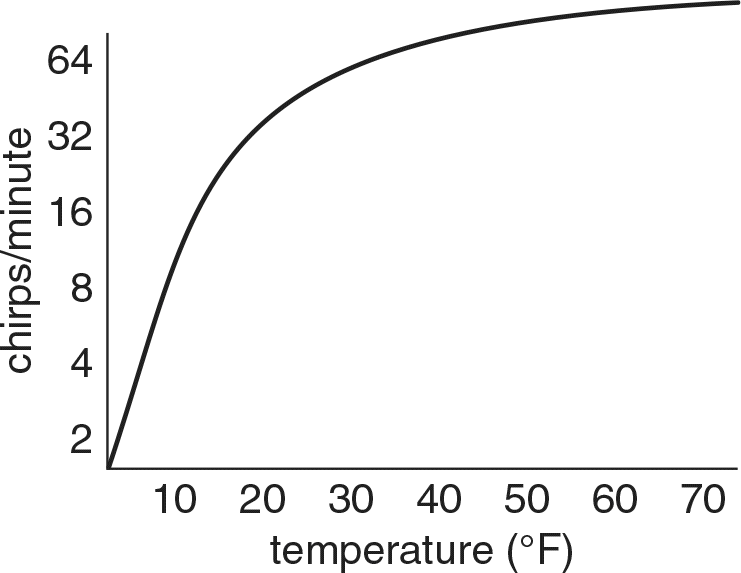
12. It is known that crickets increase their rate of chirping in a direct linear relationship with temperature until a maximum chirping rate is reached. Which of the following graphs best represents this relationship?
- A.
- B.

- C.
- D.
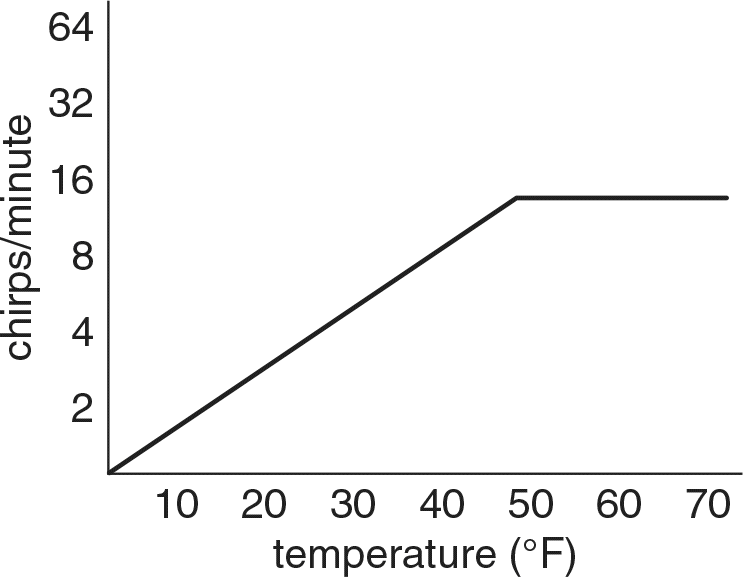
Correct Answer: B
Explanation:
The question stem indicates that there is a linear relationship, so we know that we are looking for a straight line before a plateau. We also know that linear relationships are represented on linear plots. Choice (B) matches both criteria because the axes show constant intervals. Constant ratios, as shown in choices (C) and (D), are seen in semilog plots like these, as well as log–log plots.