MCAT Math Question 39: Answer and Explanation
Home > MCAT Test > MCAT math practice tests
Test Information
- Use your browser's back button to return to your test results.
- Do more MCAT math practice tests.
Question: 39
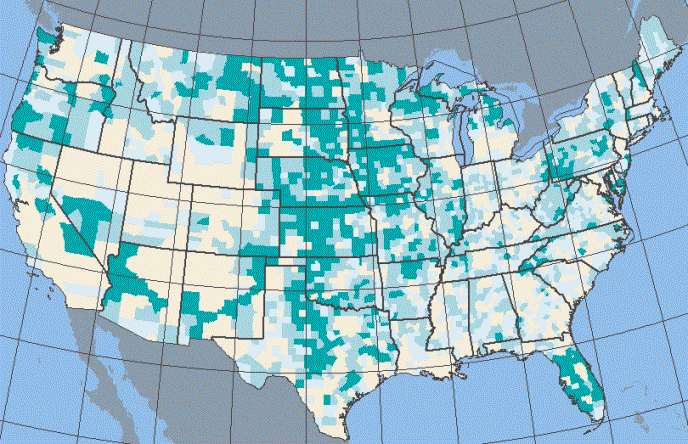
9. Based on the county-level map below, which of the following statements best represents the data about elderly individuals? (Note: The darker the shade of green, the higher the percentage of elderly persons in the county.)

- A. Most of the elderly people in the United States live in the center of the country.
- B. Most of the people living in the center of the United States are elderly.
- C. The center of the United States tends to have a larger proportion of elderly people.
- D. There are more elderly people moving to the center of the country than elsewhere.
Correct Answer: C
Explanation:
With data about percentages, we can only draw conclusions about percentages. Thus any information about number of people, as in choice (A), is incorrect. This map shows us that a higher percentage of the residents in the middle of the country are elderly in comparison to other parts of the country. There are, of course, exceptions to this rule, including Florida, the Pacific Coast, and parts of Appalachia, which are all in the top category. Even so, there appears to be a clustering of counties with a high percentage of elderly individuals in the middle of the country. We also cannot say that most of the population is elderly in any place on this map because we are not given actual values for the percentages. There may be a plurality, but there is insufficient information to posit a majority, eliminating choice (B). The map gives no indication of migration patterns, so we can also eliminate choice (D).
