MCAT Math Question 37: Answer and Explanation
Home > MCAT Test > MCAT math practice tests
Test Information
- Use your browser's back button to return to your test results.
- Do more MCAT math practice tests.
Question: 37
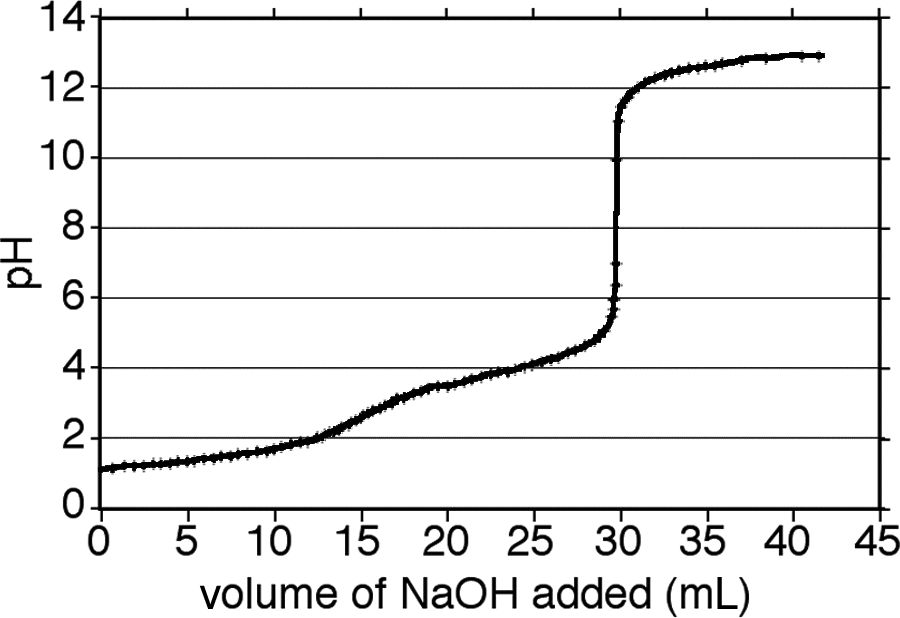
7. The following titration curve is an example of:

- A. a sigmoidal relationship on a log–log graph.
- B. a sigmoidal relationship on a linear graph.
- C. a logarithmic relationship on a semilog graph.
- D. a logarithmic relationship on a log–log graph.
Correct Answer: B
Explanation:
The first term in the answer choices describes the shape of the curve. While we did not discuss sigmoidal curves in this chapter specifically, they do show up in other places in science—in particular, for enzymes, cooperative binding, and titrations. Sigmoidal curves are S-shaped. The second term refers to the type of plot. Because the axes have the same scale throughout, this is a linear graph. Note that even though the y-axis represents logarithmic changes in H+ concentration (pH = ?log [H+]), the actual unit that is used is pH points, which increase linearly in this graph.
