GRE Math Quantitative Comparisons Question 401
Home > GRE Test > GRE Math Quantitative Comparisons Questions
Next steps
- Use your browser's back button to return to your test results.
- Do more GRE Math Quantitative Comparisons Questions.
Source: PP2
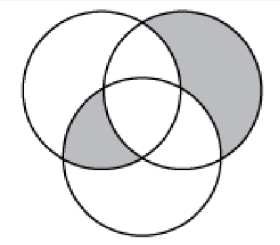 The area of each of the three circular regions in the figure shown is 40, and the area of the intersection of any two of the. circular regions is 15.
Quantity A
The surn of the areas of the shaded regions
Quantity B
30
- A The quantity in Column A is greater
- B The quantity in Column B is greater
- C The two quantities are equal.
- D The relationship cannot be determined from the information given.