GRE Math Quantitative Comparisons Question 158
Home > GRE Test > GRE Math Quantitative Comparisons Questions
Next steps
- Use your browser's back button to return to your test results.
- Do more GRE Math Quantitative Comparisons Questions.
Source: OG2
In the course of an experiment, 95 measurements were recorded, and all of the measurements were integers. The 95 measurements were then grouped into 7 measurement intervals. The graph above shows the frequency distribution of the 95 measurements by measurement interval.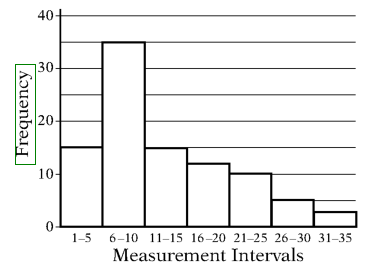
Quantity A
The average (arithmetic mean) of the 95 measurements
Quantity B
The median of the 95 measurements
- A Quantity A is greater.
- B Quantity B is greater.
- C The two quantities are equal.
- D The relationship cannot be determined from the information given.