GRE Math Quantitative Comparisons Question 153
Home > GRE Test > GRE Math Quantitative Comparisons Questions
Next steps
- Use your browser's back button to return to your test results.
- Do more GRE Math Quantitative Comparisons Questions.
Source: OG2
List X and list Y each contain 60 numbers. Frequency distributions for each list are given above. The average (arithmetic mean) of the numbers in list X is 2.7, and the average of the numbers in list Y is 7.1. List Z contains 120 numbers: the 60 numbers in list X and the 60 numbers in list Y.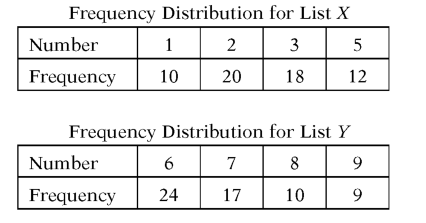
Quantity A
The average of the 120 numbers in list Z
Quantity B
The median of the 120 numbers in list Z
- A Quantity A is greater.
- B Quantity B is greater.
- C The two quantities are equal.
- D The relationship cannot be determined from the information given.