GRE Math Quantitative Comparisons Question 132
Home > GRE Test > GRE Math Quantitative Comparisons Questions
Next steps
- Use your browser's back button to return to your test results.
- Do more GRE Math Quantitative Comparisons Questions.
Source: OG2
The graph above shows the frequency distribution of 50 integer values varying from 1 to 6.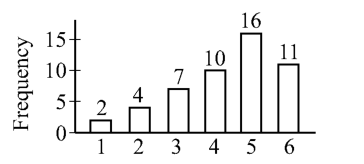
Quantity A
The average (arithmetic mean) of the 50 values
Quantity B
The median of the 50 values
- A Quantity A is greater.
- B Quantity B is greater.
- C The two quantities are equal.
- D The relationship cannot be determined from the information given.