GRE Problem Solving Question 365
Home > GRE Test > GRE Problem Solving Questions
Next steps
- Use your browser's back button to return to your test results.
- Do more GRE Problem Solving Questions.
Source: 150math
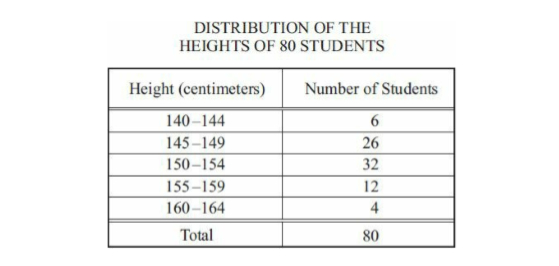 The table above shows the frequency distribution of the heights of 80 students. What is the least possible range of the heights of the 80 students?
- A 15
- B 16
- C 20
- D 24
- E 28