GRE Math Numeric Entry Question 67
Home > GRE Test > GRE Math Numeric Entry Questions
Next steps
- Use your browser's back button to return to your test results.
- Do more GRE Math Numeric Entry Questions.
Source: 150math
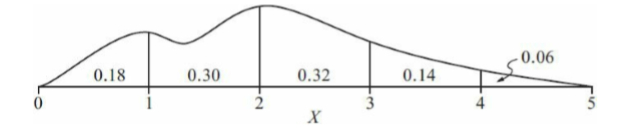 The figure above shows the probability distribution of a continuous random variable X. For each of the five intervals shown, the figure gives the probability that the value of X is in that interval. What is the probability that 1 < X < 4 ?