MCAT Physics Question 132: Answer and Explanation
Home > MCAT Test > MCAT physics practice tests
Test Information
- Use your browser's back button to return to your test results.
- Do more MCAT physics practice tests.
Question: 132
12. A graph of an exponential decay process is created. The y-axis is the natural logarithm of the ratio of the number of intact nuclei at a given time to the number of intact nuclei at time t = 0. The x-axis is time. What does the slope of such a graph represent?
- A. λ
- B. - λ
- C. e-λt
- D.

Correct Answer: B
Explanation:
The expression n = n0e?λt is equivalent to

Taking the natural logarithm of both sides, we get:
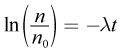
From this expression, it is clear that plotting ln

vs. t will give a straight line with a slope of ?λ.